
A Visual Tracer for Teaching Programming
A while ago, I posted about teaching CS as an interface design problem . In that post, I talked about the need for better visualization tools to help students acquire a mental model of how programs execute. I’ve been thinking about this problem and am leaning towards the idea of an IDE specifically designed for novice programmers.
Most IDEs are designed to help programmers write code more efficiently. They provide features like syntax highlighting, code completion, and debugging tools. However, though useful, these features usually assume that the user already knows something about programming. The many options and features of a full IDE can be overwhelming for beginners.
An idea for a visual tracer
One thing a lot of my students struggle with is understanding function calls and the flow of execution in a program. There are several problems related to this (these are just a few):
- Difference between a function definition and a function call;
- Changes in the flow of execution due to function calls;
- The scope of variables;
- Differences between passing by value and passing by reference;
- The return value of a function.
I think a visual tracer could help with these problems. There’s nothing really new here, as there are already tools like Python Tutor that do this. I couldn’t find a good way to communicate my ideas, but I made some sketches to illustrate what I have in mind.
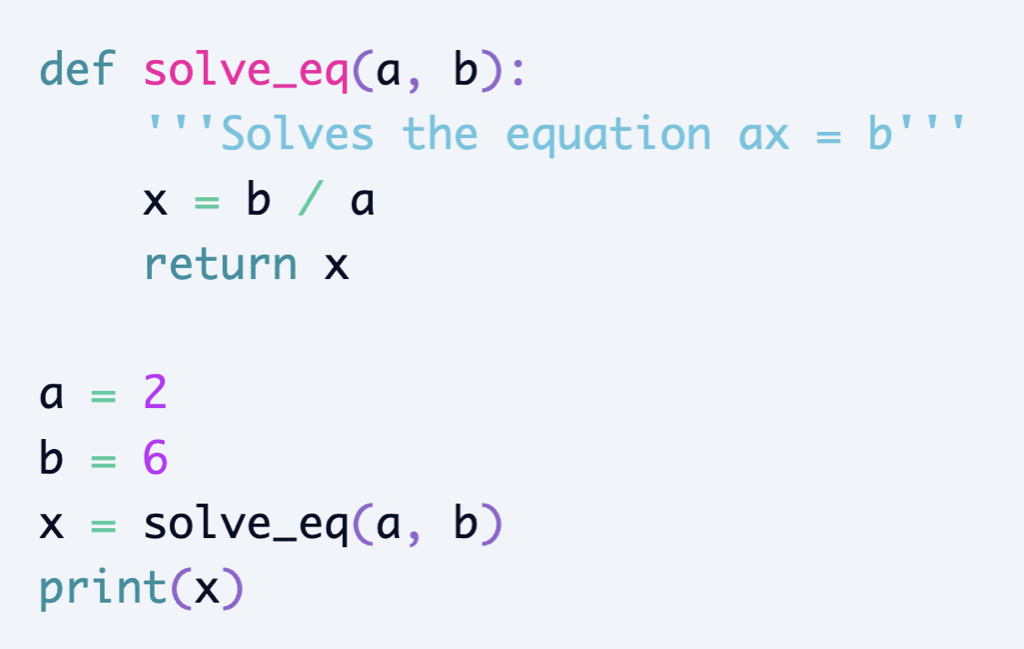
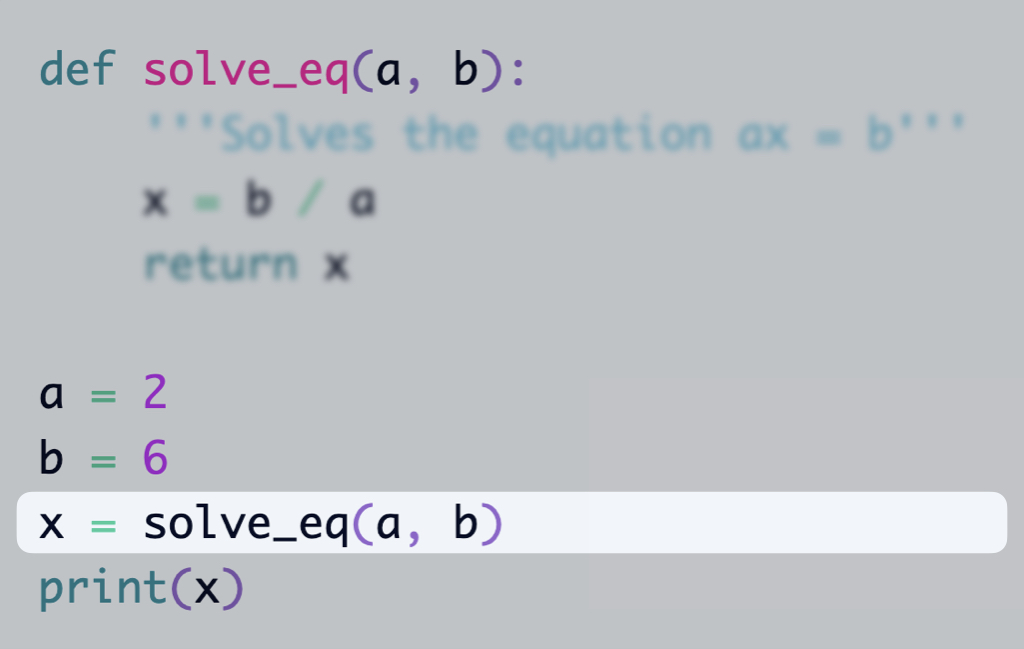
The editor shows the source code.
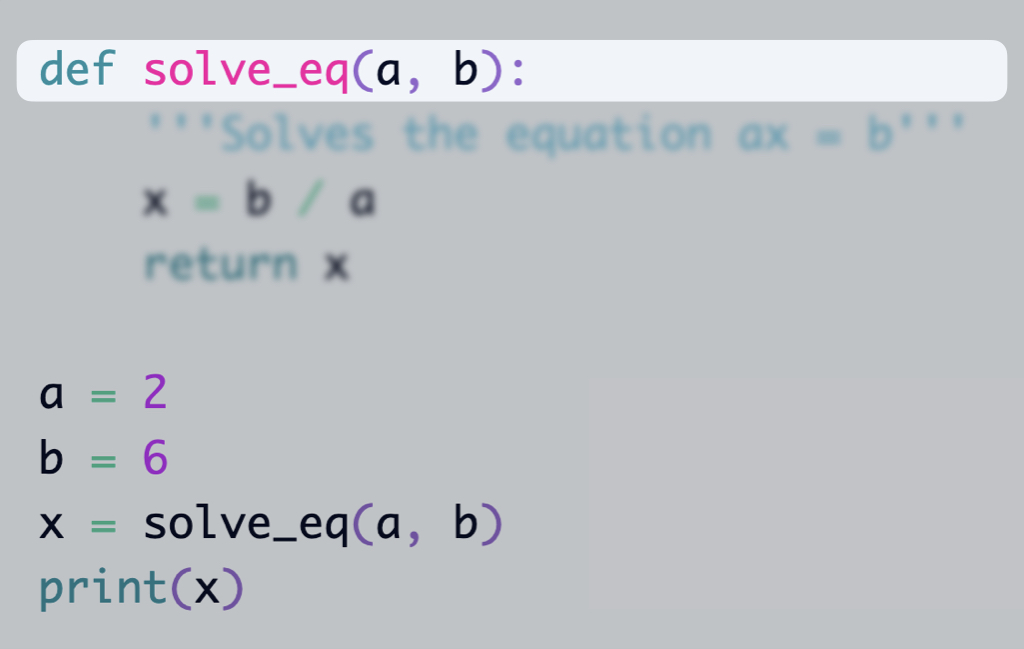
The current line being executed is highlighted. The lines that are not part of the current scope are blurred.
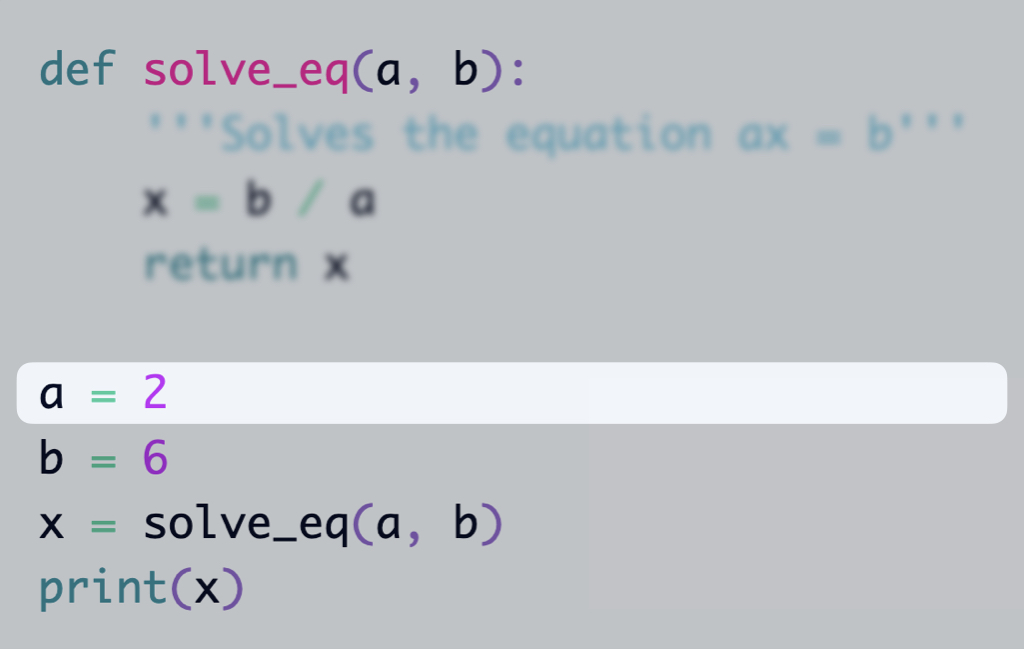
There should be a place showing the variables and their values in the current scope.
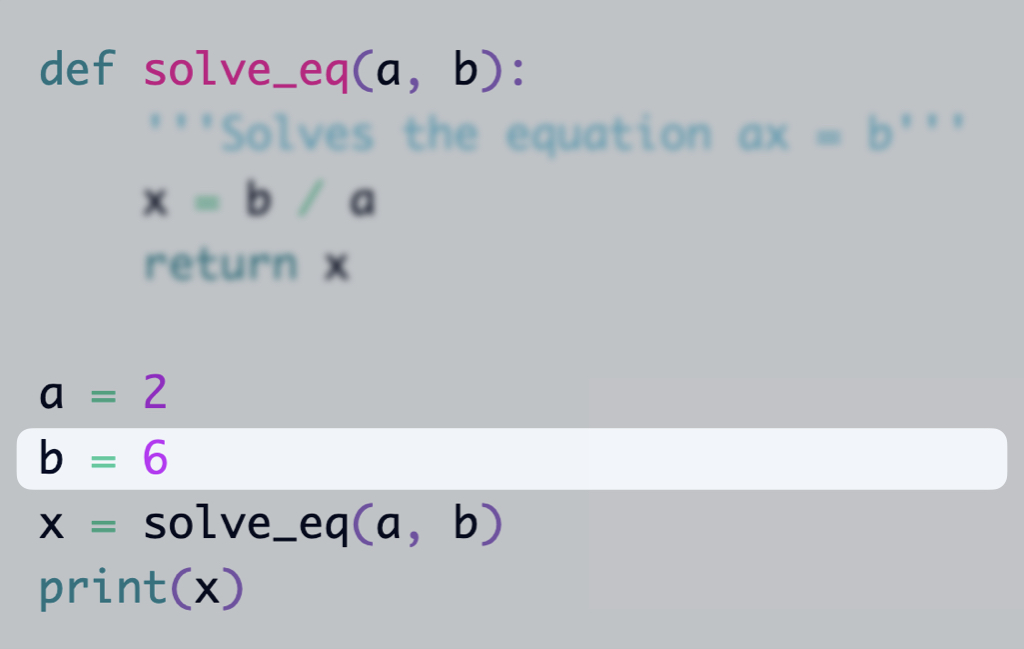
The values should be created/updated as the code is executed
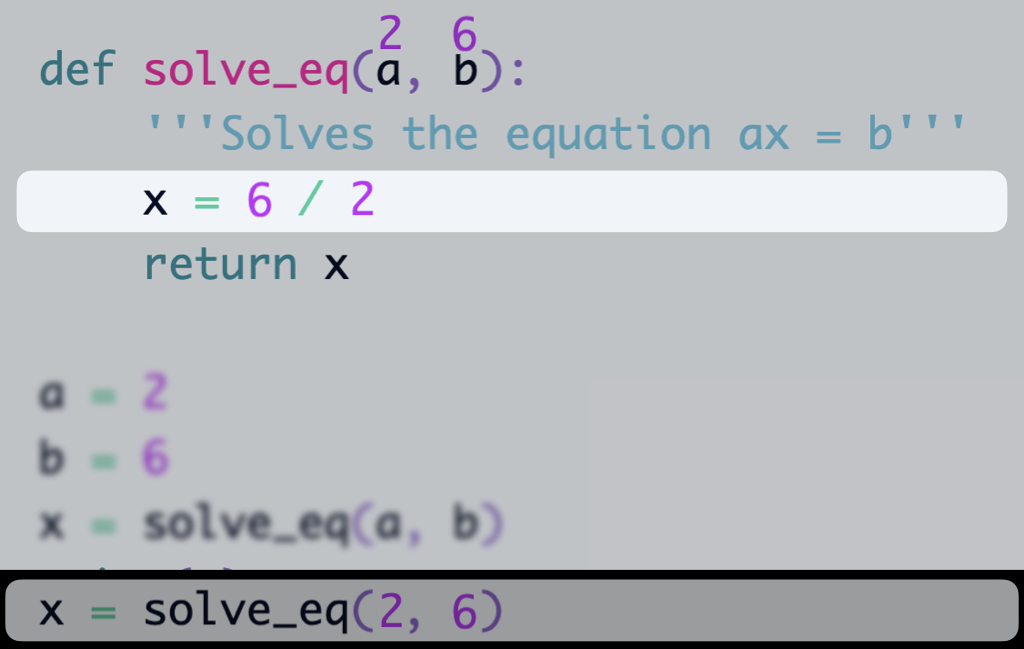
Lines may contain several operations.
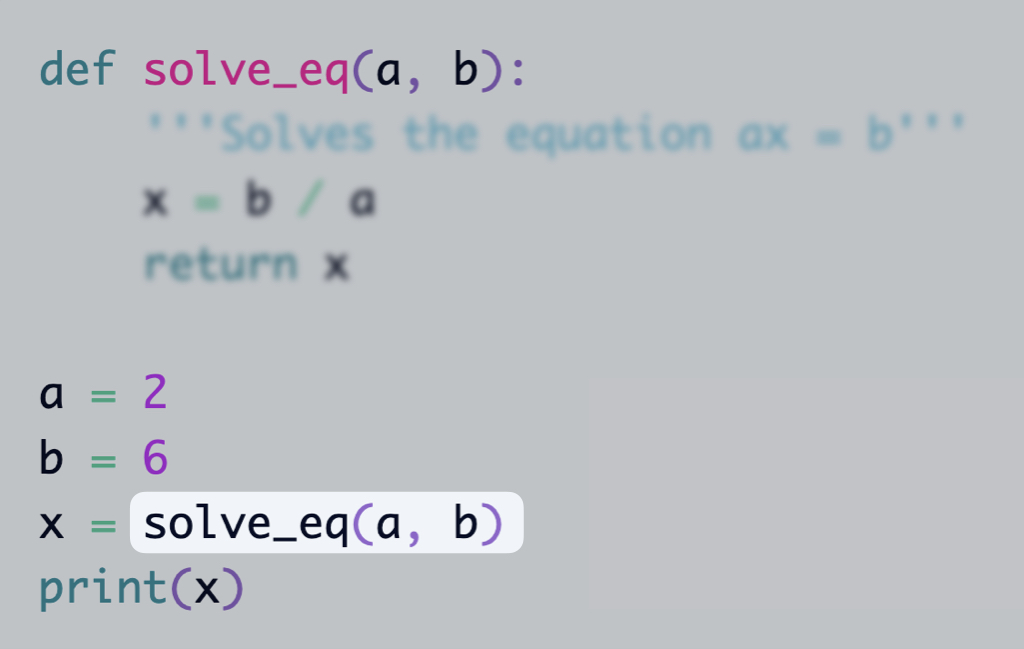
The current operation being executed is highlighted.
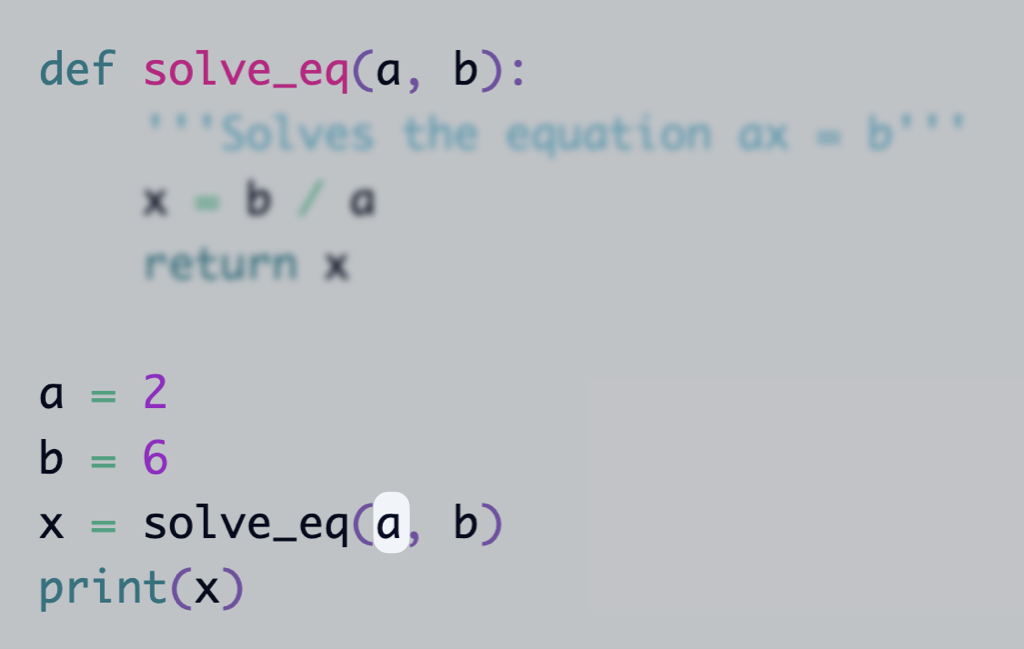
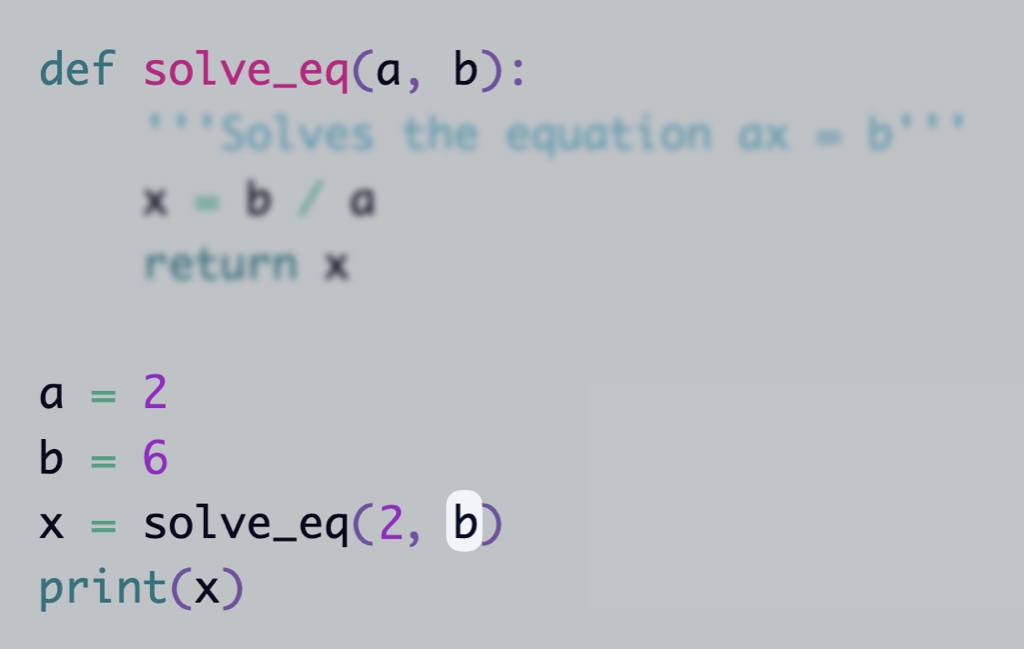
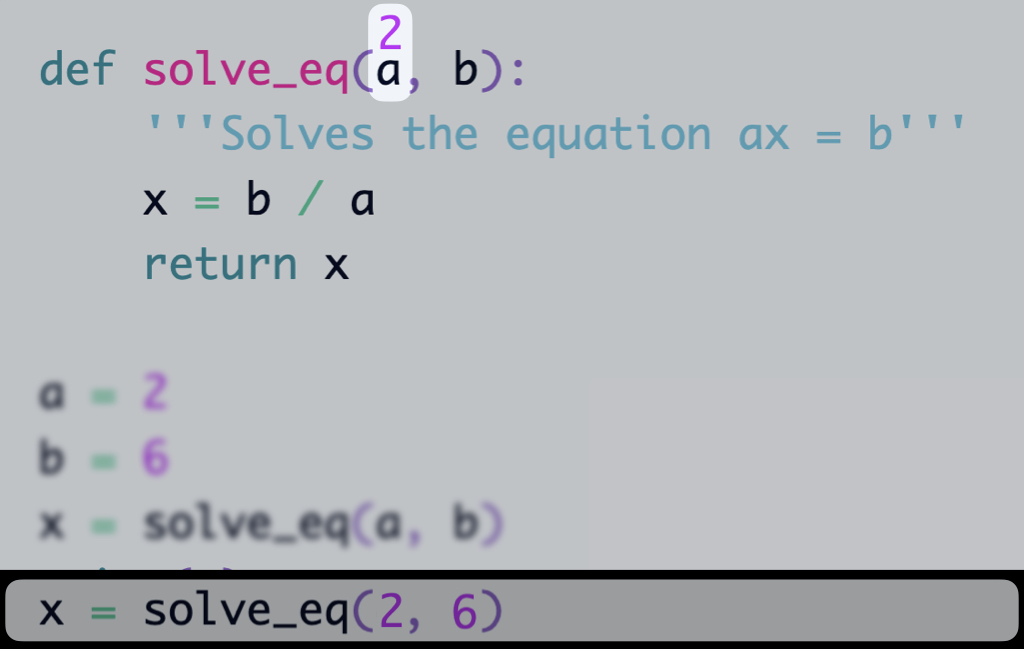
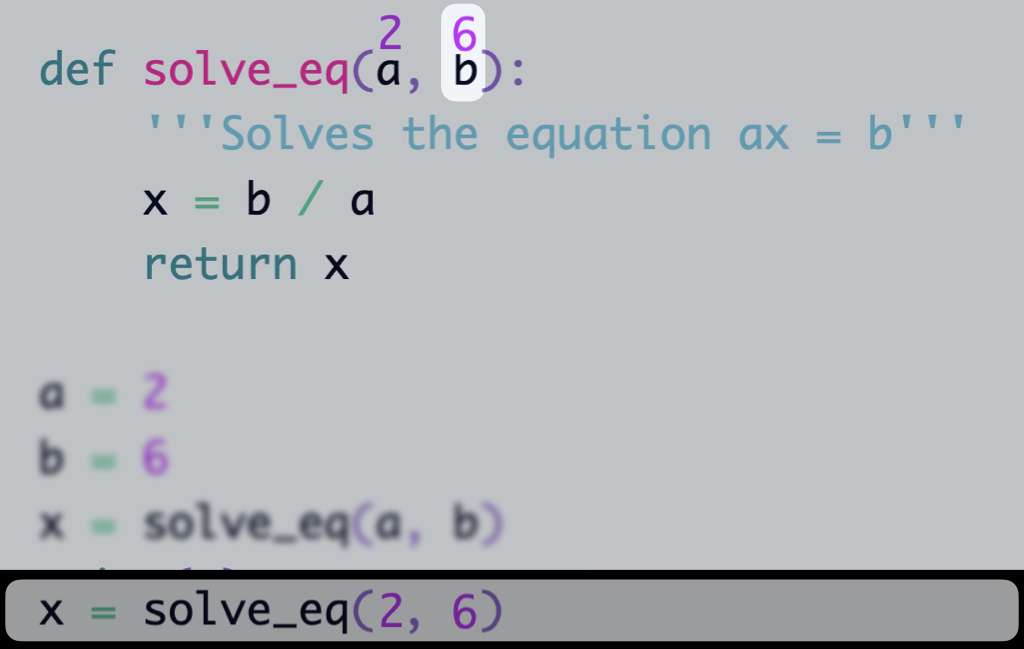
To call the function, the arguments must be replaced by their values.
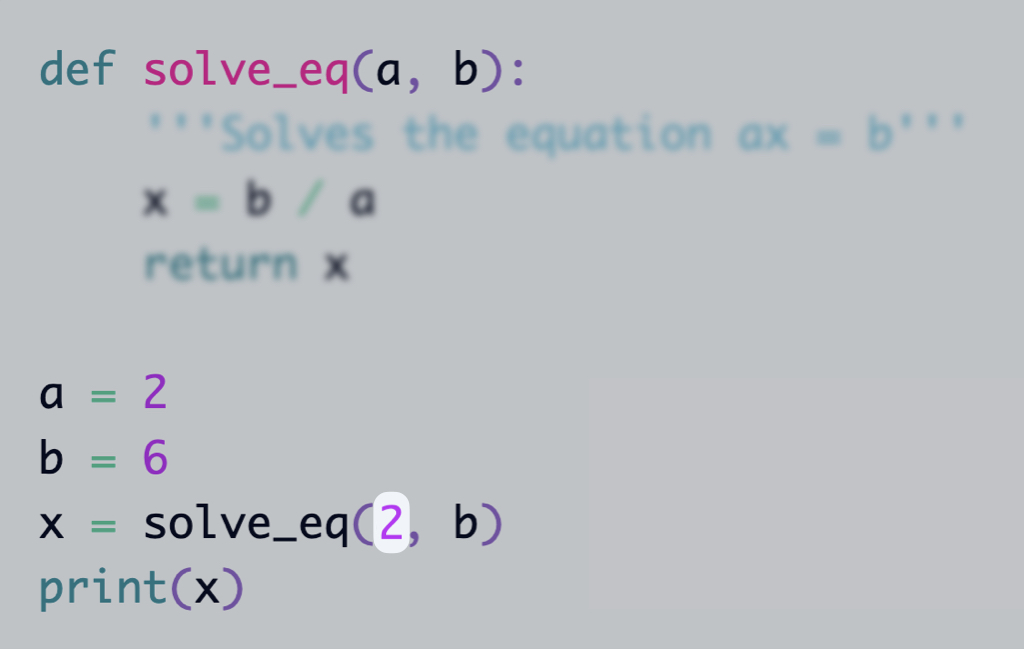
The variable evaluation occurs from left to right. The student doesn't need to know this, but as they see it happening, they may start to internalize it.
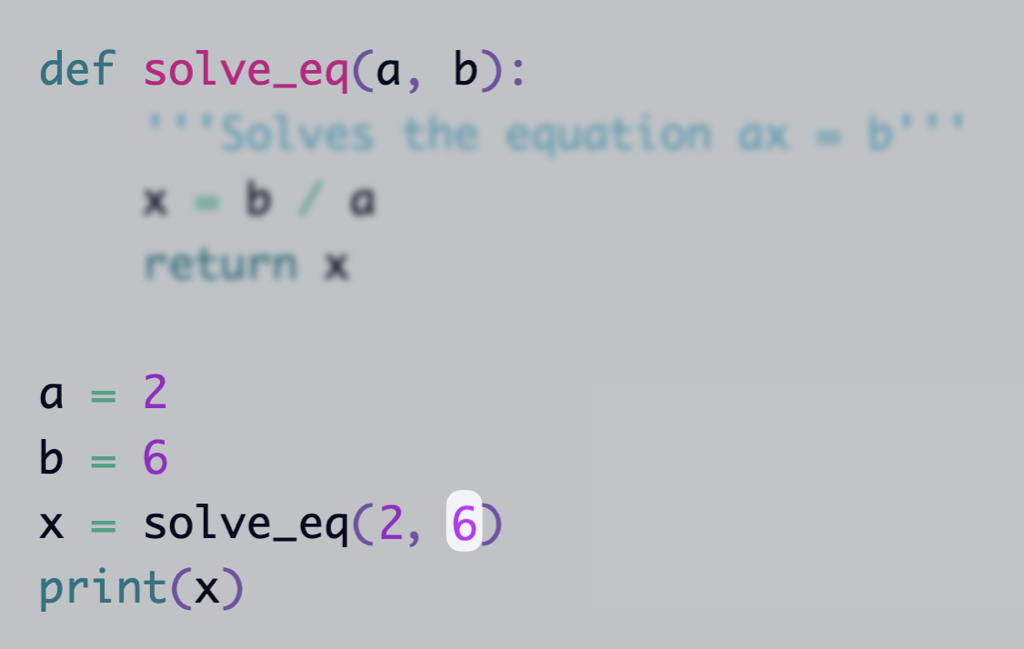
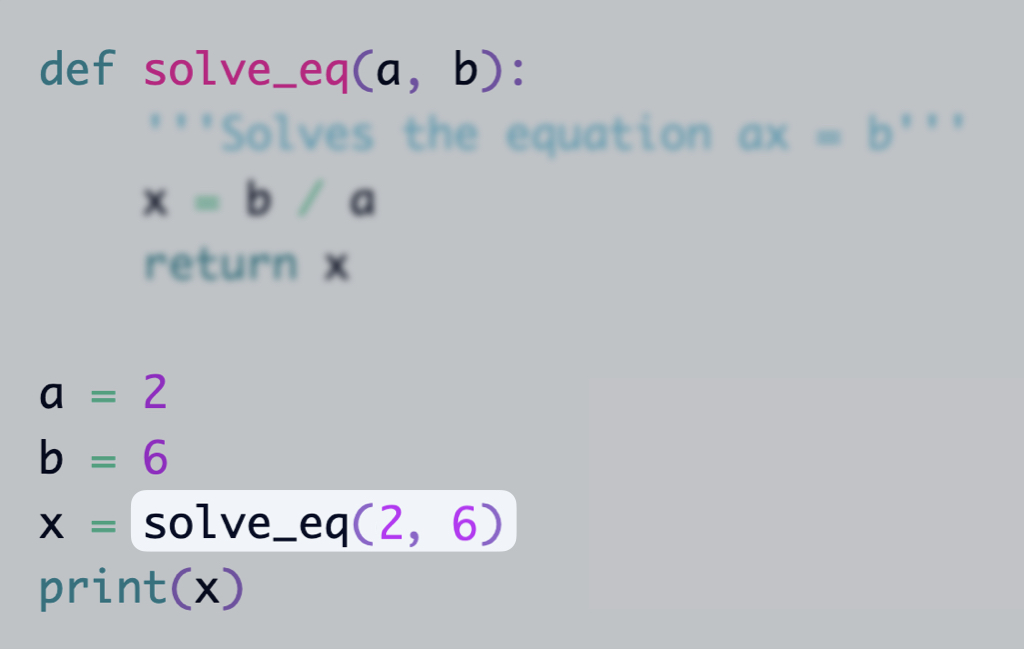
Now the function can be called.
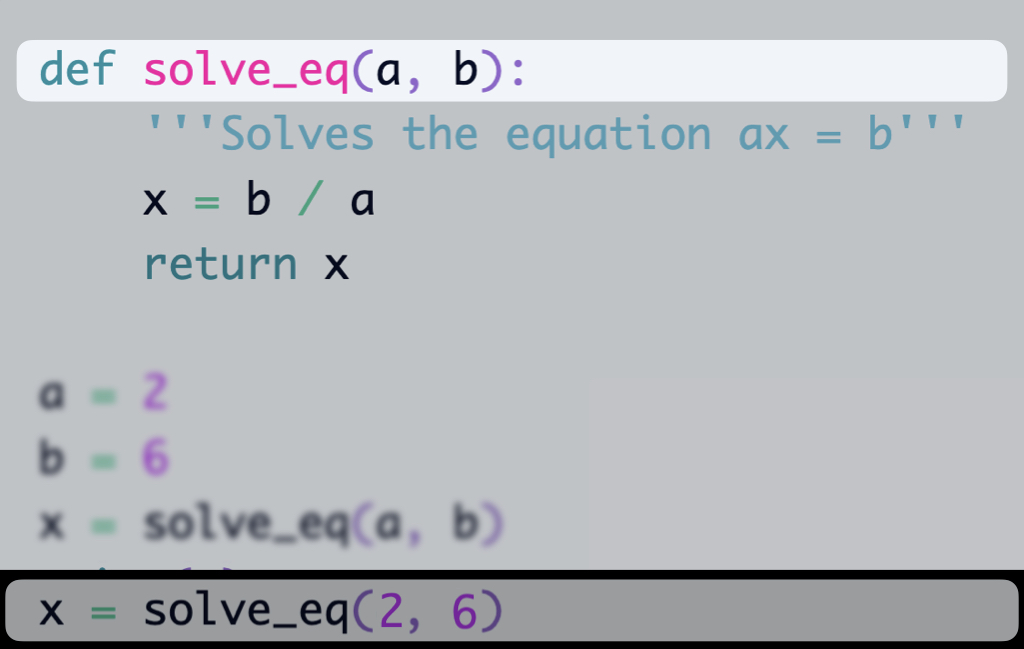
The editor shrinks around the function call. The line with the function call remains in the bottom while a copy of the editor is created above it. The idea is to show that there is a stack, and the function call is added to it. The code that is part of this scope is unblurred, while the rest of the code is blurred. If there are more function calls (e.g. recursion), the same process will be repeated and the stack will grow.
I'm not sure how to do it, but there should be a way to show that the arguments are variables in the current scope and they are assigned values when the function is called.
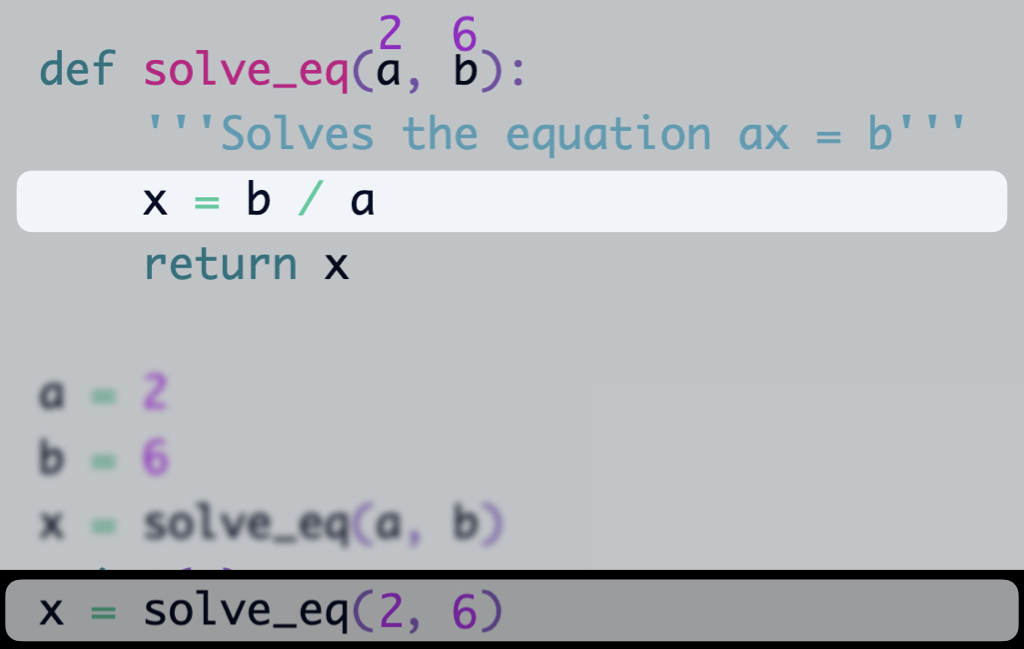
The function code starts to be executed.
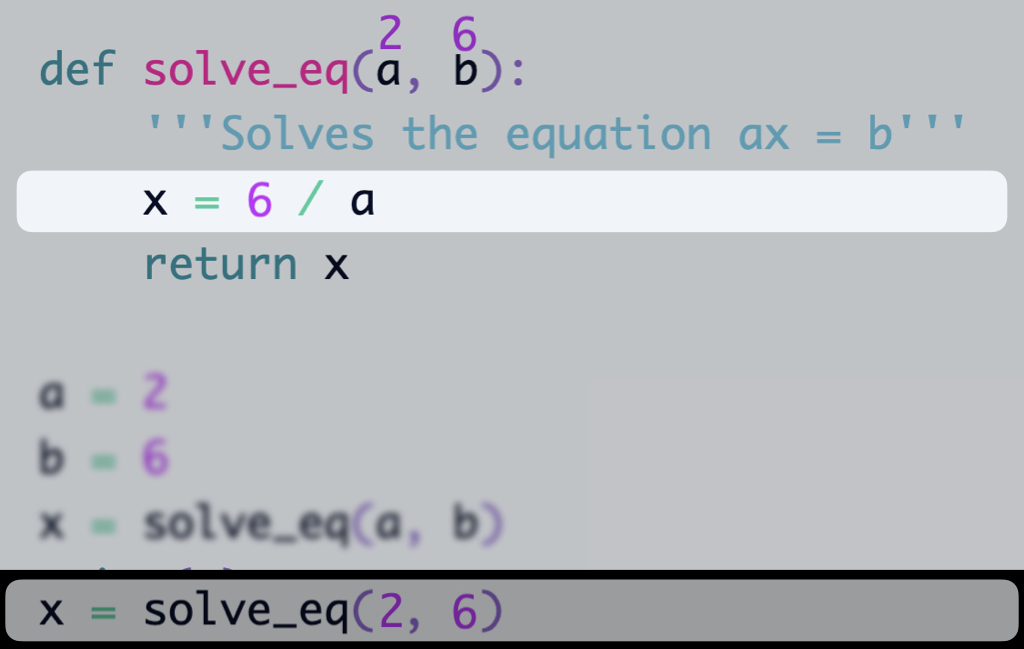
Variables are replaced by their values
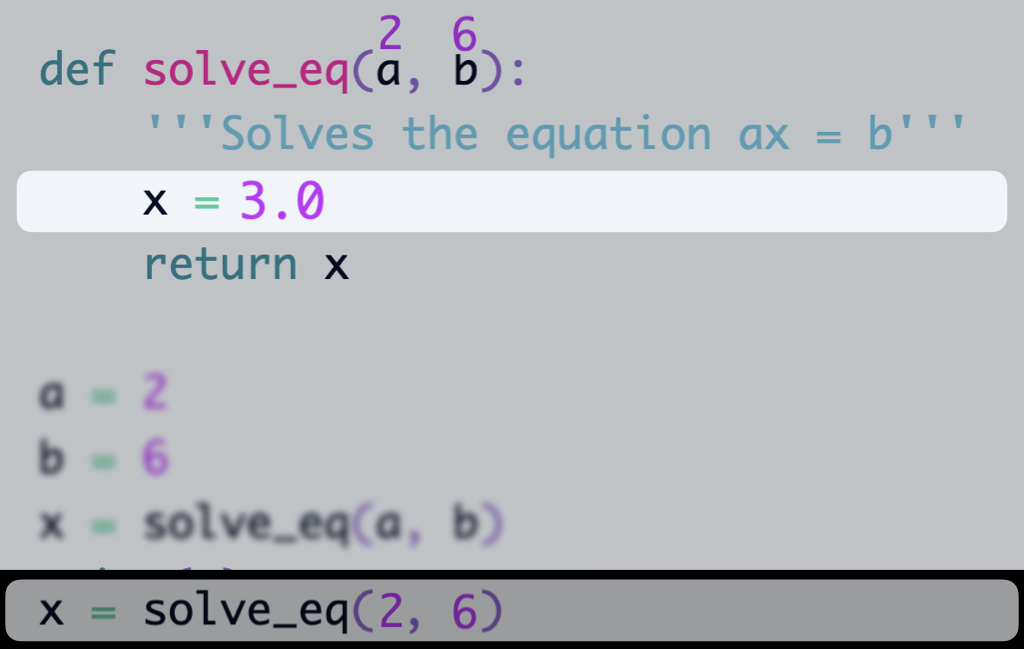
The result is a float number. We don't need to explicitly say this. But this may be an opportunity for the student to question their mental model.
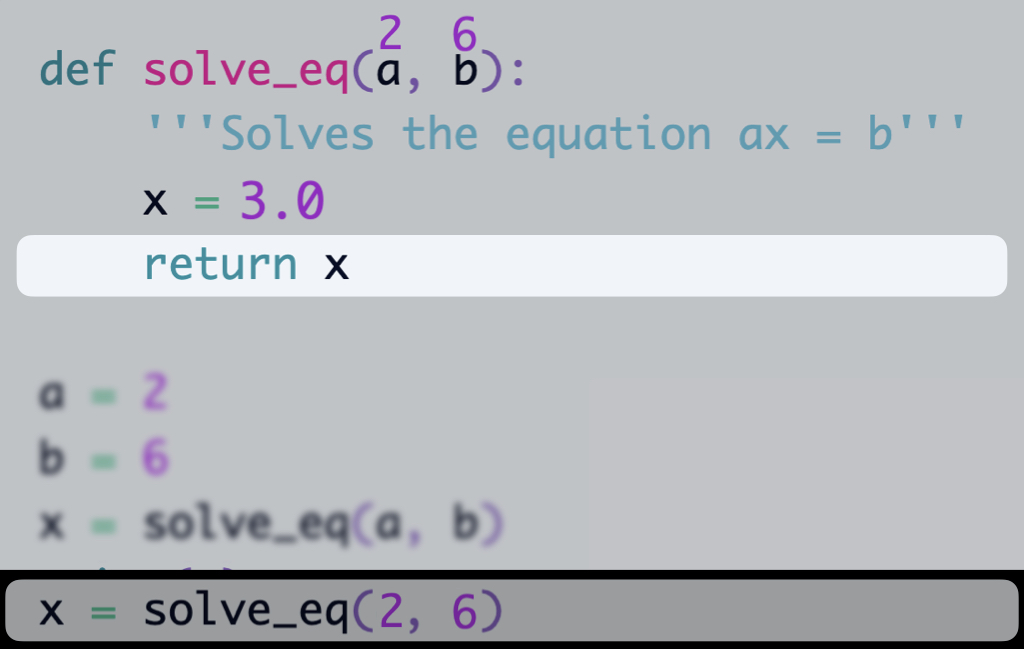
Returning a variable means that the function will return the value of that variable.
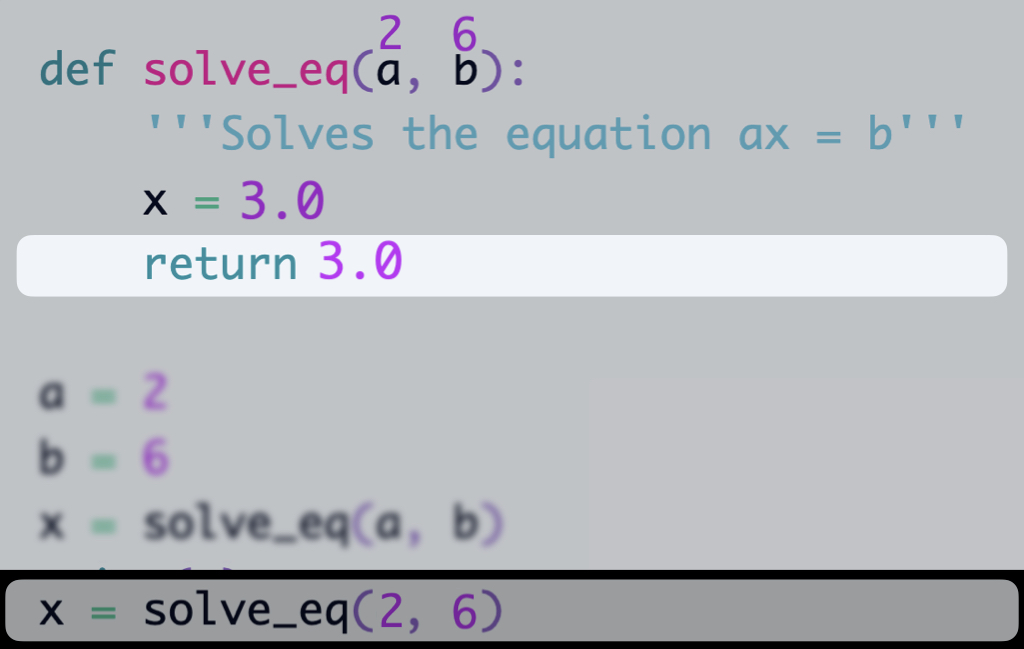
So we evaluate the expression and return the result. Since this is a return statement, the context is removed from the stack with some shrinking animation and the return value moves to the function call.

The function call will be replaced by the return value. The scope changes and the variables that existed in the function don't exist anymore.
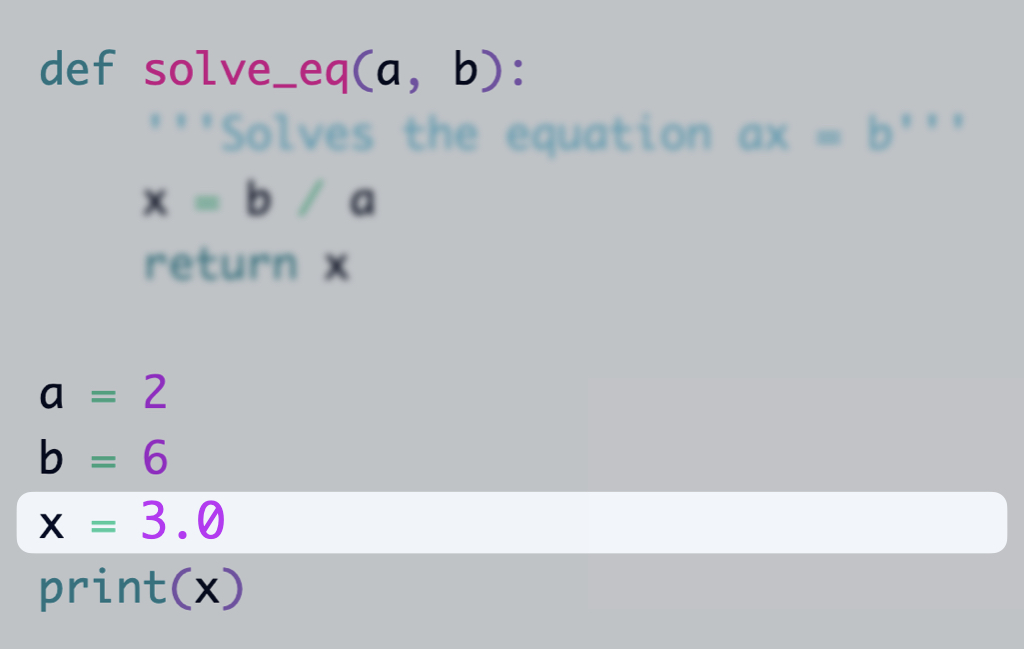
The motivation is that the student can see that after we get the value from the function, there is no way to know that it was a function call. It's just a value.
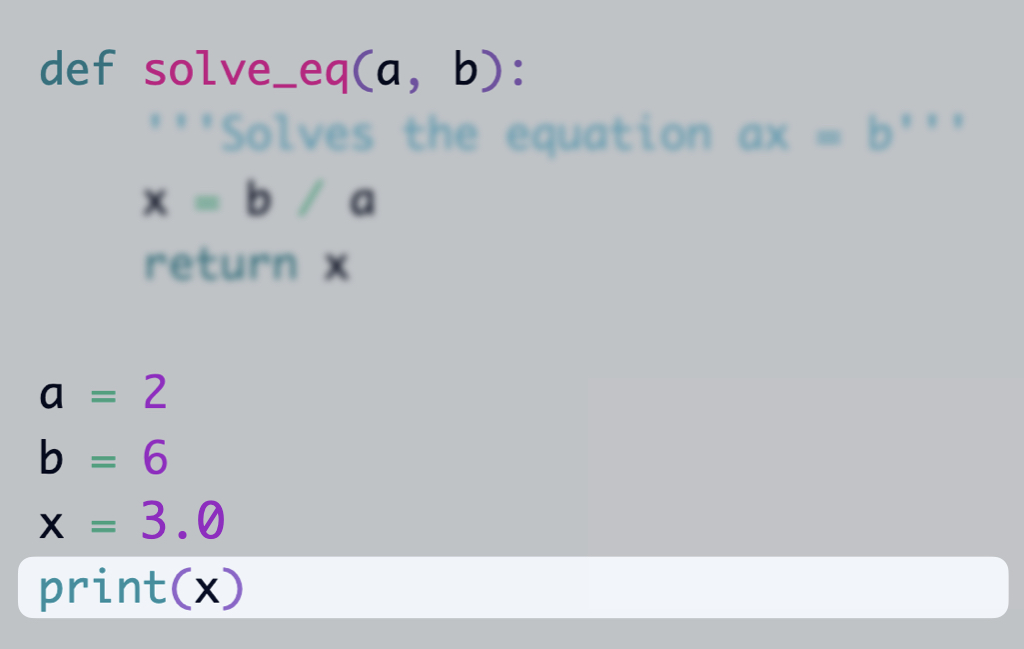
This is also a function call, but I'm not sure if builtin functions should be treated differently.
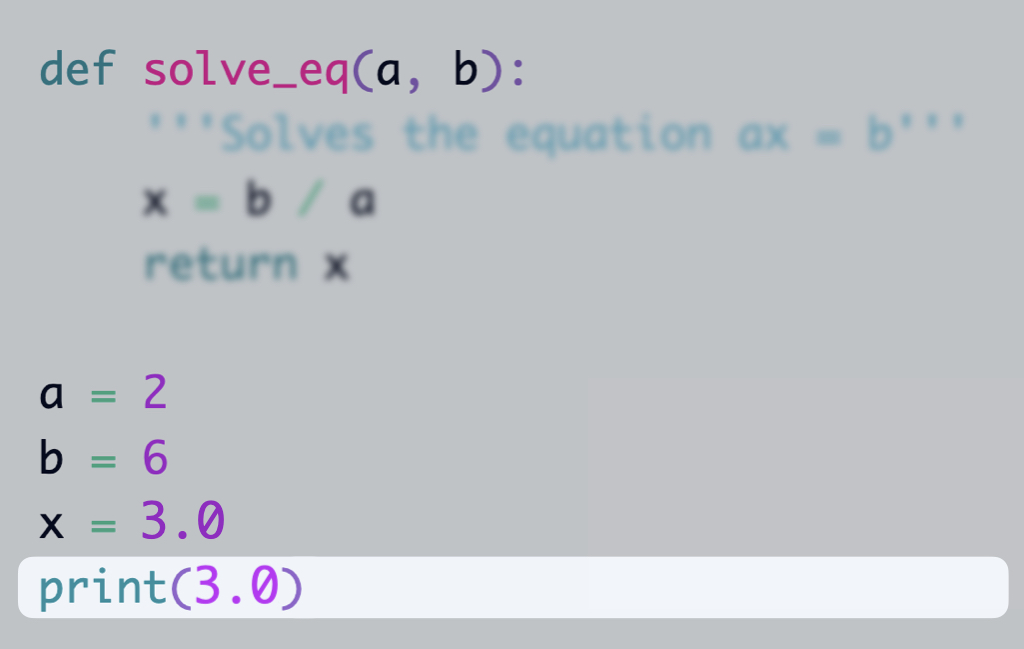
There should be a place to display the standard output.
Default execution mode
In most (all?) IDEs, when we run a program, the default mode is to execute the program from the beginning to the end. This makes sense, as this is how programs are usually executed. However, for beginners, this can give the impression that the program is “understood” by the computer as a unity and after understanding the programmer’s intent, the computer executes it.
I believe that for beginners, it would be more helpful to have the “slow motion” mode as the default. In this mode, the program would execute one step at a time, and the programmer could see the changes in the memory and the flow of execution. It would be more like watching a movie: you can pause, rewind, and fast forward. Then, once the student is more comfortable with the concepts, they could switch to the “normal” mode.