
Visualizing Sorting Algorithms: Teaching with Interactive Videos
One of the biggest challenges in teaching algorithms is helping students develop the right mental model. As experienced computer scientists, we don’t just see algorithms as a series of steps -— we visualize them as dynamic processes manipulating data structures.
When I teach my algorithms course, I emphasize abstraction as a key tool for structuring complex problems. This is why we use pseudo-code instead of a specific programming language: it keeps the focus on the algorithm itself, without the distractions of syntax.
But there’s a deeper challenge: how do we help students see the mental movie that plays in our minds?
The Mental Movie of an Algorithm
At some point in our learning journey, we start seeing algorithms visually. A simple line like:
node = node->next
becomes a pointer moving from one node to another. The execution of an algorithm transforms into a visual process, not just lines of code.
For many of us, this shift happens gradually, often without realizing it. But when I think back, I see how my teachers’ sketches on the board -— their arrows, gestures, and repeated explanations—were crucial. They helped me form the mental model I now use instinctively.
As a researcher in Human-Computer Interaction (HCI), I wanted to explore how we could transfer this mental model more effectively. Could interactive visualizations help students “see” sorting algorithms the way we do?
Bringing Algorithms to Life
To help my students develop this intuition, I created interactive algorithm animations. These animations let students observe the algorithm in action, step by step, reinforcing key concepts like:
- How elements move in Insertion Sort
- How comparisons and swaps happen in Bubble Sort
- How auxiliary arrays work in Counting Sort
In HCI, we call these mechanisms, mental models —- the way we understand how a system behaves.
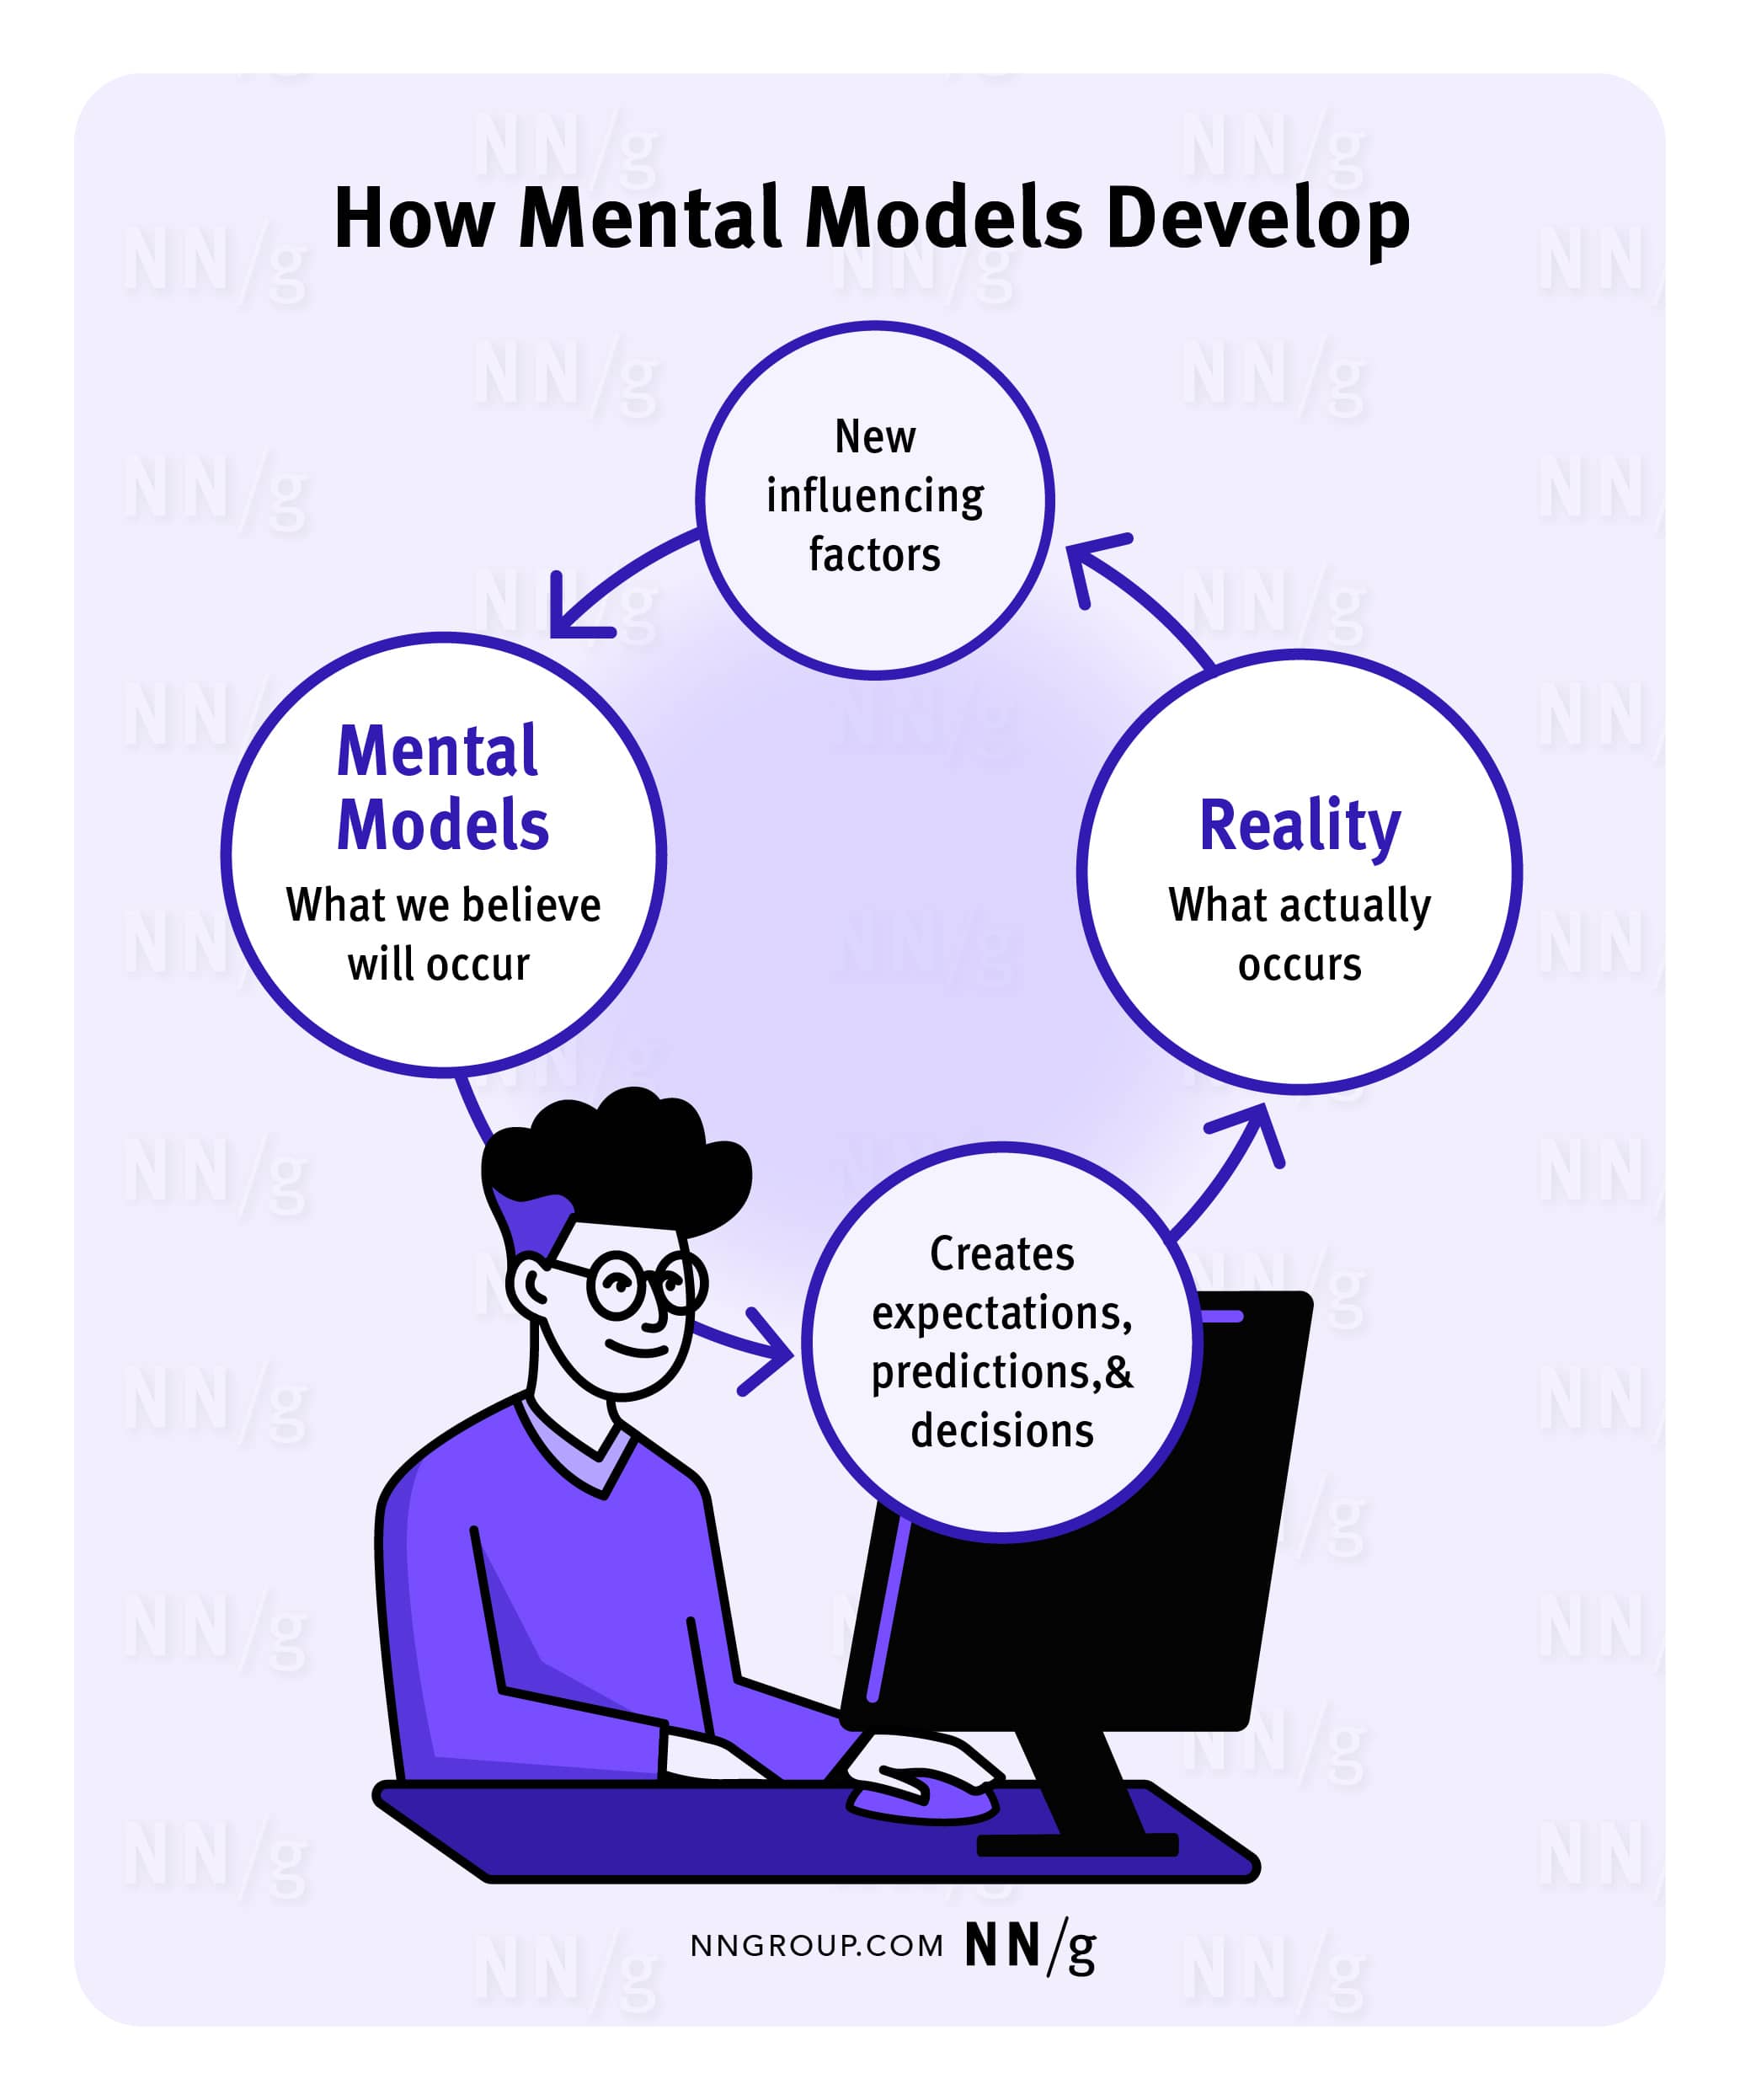
Mental model diagram by Nielsen and Norman Group
How It Works
To create these materials, I used:
- React for interactive UI components
- Remotion for generating animations
- Astro for building the site
- Theory from CLRS & Jeff Erickson’s “Algorithms” for algorithm explanations
Each animation is based on a TypeScript implementation that logs the algorithm’s state at each step. These snapshots are then played as a video, showing how the algorithm progresses over time. I also replicated the pseudo-code styling from CLRS to make it look familiar to the students.
Interactive Sorting Algorithm Videos
Insertion Sort
The first visualization I created was for Insertion Sort -— an intuitive algorithm that helps students understand how elements shift into place. I wanted to show that the integer variables i and j should be understood as pointers to elements of the array.
By adjusting playback speed and testing different inputs, students can identify best and worst-case scenarios and analyze the algorithm’s performance.
Selection Sort
Another visualization follows Selection Sort, reinforcing the concept of finding the smallest element and placing it in order.
Bubblesort
Bubble Sort is a great example to discuss optimizations. The first video shows the basic algorithm:
After discussing potential improvements, students can compare it with an optimized version:
Counting Sort
For more advanced students, Counting Sort introduces the idea of non-comparison-based sorting.
Understanding how the auxiliary arrays work can be tricky, so this visualization helps students track how elements are counted and placed in order. Based on my experience from this semester, I think I still need to iterate on this interactive video.
Radix Sort
Finally, students explore Radix Sort, which builds on Counting Sort and introduces new ways to approach sorting.
What’s Next?
So far, the feedback has been overwhelmingly positive. Students engage with the materials, experiment with different inputs, and actively discuss algorithm behavior in class.
I still have ideas for improvements —- especially in making Counting Sort clearer —- and I plan to expand this approach to other algorithms.
If you’re interested in these visualizations, let me know! I’d love to hear your thoughts and explore ways to make algorithm learning even more intuitive.